Technical indicators are widely used in crypto trading to analyze price movements, identify trends, and make informed trading decisions. While there are numerous indicators available, some of the most popular and effective indicators for crypto trading include:
Moving averages
Moving averages (MAs) are a popular technical indicator used in crypto trading to identify trends, smooth out price data, and generate buy and sell signals. While they are not foolproof and can sometimes lead to false signals, MAs can be a valuable tool for traders of all experience levels.
How to Calculate Moving Averages
Moving averages are calculated by averaging the closing prices of a security over a specified number of periods. For example, a 20-period SMA is calculated by averaging the closing prices of the past 20 periods. There are two main types of moving averages: simple moving averages (SMAs) and exponential moving averages (EMAs). SMAs give equal weight to all prices within the period, while EMAs give more weight to recent prices.
Using Moving Averages for Trend Identification
Moving averages can be used to identify trends by looking for the direction of the moving average line. If the moving average is sloping upwards, it indicates that the trend is bullish. If the moving average is sloping downwards, it indicates that the trend is bearish.
Using Moving Averages for Support and Resistance
Moving averages can also be used to identify potential support and resistance levels. Support is a price level where buyers are more likely to step in and prevent the price from falling further. Resistance is a price level where sellers are more likely to step in and prevent the price from rising further. When the price approaches a moving average line, it can act as a support or resistance level.
Using Moving Averages for Buy and Sell Signals
Moving averages can also be used to generate buy and sell signals. One common strategy is to look for crossovers between two moving averages. For example, a trader might look for a crossover between a 50-period SMA and a 200-period SMA. If the 50-period SMA crosses above the 200-period SMA, it is a bullish signal and the trader might buy the security. If the 50-period SMA crosses below the 200-period SMA, it is a bearish signal and the trader might sell the security.
Limitations of Moving Averages
Moving averages are a lagging indicator, which means that they are based on past price data and do not take into account future information. This means that moving averages can sometimes give false signals, especially in volatile markets. Additionally, moving averages can be ineffective in sideways markets, where there is no clear trend.
Relative Strength Index (RSI)
The Relative Strength Index (RSI) is a widely used momentum oscillator in crypto trading that measures the speed and magnitude of recent price movements. Displayed on a scale from 0 to 100, it helps traders spot overbought and oversold conditions as well as potential shifts in market momentum. While it is straightforward to read, traders typically pair it with other tools to avoid acting on premature signals.
How to Calculate RSI
The RSI is calculated using a two-step formula that compares average gains to average losses over a specified number of periods, with 14 periods being the standard default. First, the average gain over the lookback period is divided by the average loss to produce a value known as Relative Strength (RS). That figure is then indexed onto a 0 to 100 scale so traders can easily compare momentum across different cryptocurrencies and timeframes.
Using RSI for Overbought and Oversold Conditions
Traders primarily use the RSI to determine whether a cryptocurrency has been pushed too far in one direction. When the RSI rises above 70, it suggests that the asset may be overbought and due for a pullback or consolidation. Conversely, when the RSI drops below 30, it indicates that the market may be oversold and could experience a bounce.
Using RSI for Divergences
The RSI can also reveal weakening momentum through divergences between the indicator and the price chart. A bullish divergence occurs when the cryptocurrency’s price makes a lower low, but the RSI forms a higher low, suggesting that selling pressure is fading. A bearish divergence happens when the price reaches a higher high while the RSI records a lower high, signaling that upward momentum is slowing down.
Using RSI for Buy and Sell Signals
Traders often generate buy and sell signals by watching how the RSI crosses its key threshold lines. For example, a trader might look for a buy signal when the RSI dips below 30 and then crosses back above it, confirming that buyers are regaining control. Similarly, if the RSI climbs above 70 and subsequently crosses back below that level, it can serve as a bearish signal to take profits or open a short position.
Limitations of RSI
In strong crypto bull or bear markets, the RSI can remain in overbought or oversold territory for extended periods while the price continues trending in the same direction. Relying solely on the 70 and 30 levels during a powerful breakout can cause traders to exit winning trades too early or enter counter-trend positions prematurely.
Moving Average Convergence Divergence (MACD)
The Moving Average Convergence Divergence (MACD) is a trend-following momentum indicator that shows the relationship between two moving averages of a cryptocurrency’s price. By tracking whether those averages are moving closer together or farther apart, the MACD helps traders gauge trend direction, momentum strength, and potential reversals.
How to Calculate MACD
The MACD is calculated by subtracting the 26-period exponential moving average (EMA) from the 12-period EMA, which creates the main MACD line. A 9-period EMA of the MACD line is then plotted alongside it as the signal line. Finally, the MACD histogram plots the vertical distance between the MACD line and the signal line, making shifts in momentum visually clear.
Using MACD for Trend Direction and Momentum
Traders look at the position of the MACD line relative to the zero centerline to assess the broader trend. When the MACD line is above zero, it means the shorter-term 12-period EMA is above the longer-term 26-period EMA, indicating bullish momentum. When the MACD line falls below zero, it signals bearish momentum, while expanding histogram bars show that the current move is gaining strength.
Using MACD for Divergences
Similar to the RSI, the MACD can highlight potential trend reversals when its trajectory disagrees with price action. If a cryptocurrency sets a new price high while the MACD peaks at a lower high, this bearish divergence warns that buying momentum is weakening. When the price drops to a new low but the MACD forms a higher low, a bullish divergence suggests that the downtrend may soon lose steam.
Using MACD for Buy and Sell Signals
The most common MACD trading strategy relies on crossovers between the MACD line and the signal line. When the MACD line crosses above the signal line, it generates a bullish signal that traders may use as a buying opportunity. When the MACD line crosses below the signal line, it generates a bearish signal suggesting it may be time to sell.
Limitations of MACD
Because the MACD is built entirely from moving averages, it is a lagging indicator that reacts after a price move has already begun. In choppy, range-bound crypto markets, the MACD line and signal line frequently cross back and forth, producing numerous false signals that can lead to whipsaw losses.
Bollinger Bands
Bollinger Bands are a popular volatility indicator that plots a dynamic price channel around a moving average. Developed to adapt to changing market conditions, they help crypto traders recognize periods of quiet consolidation, anticipate sharp breakouts, and spot extreme price extensions.
How to Calculate Bollinger Bands
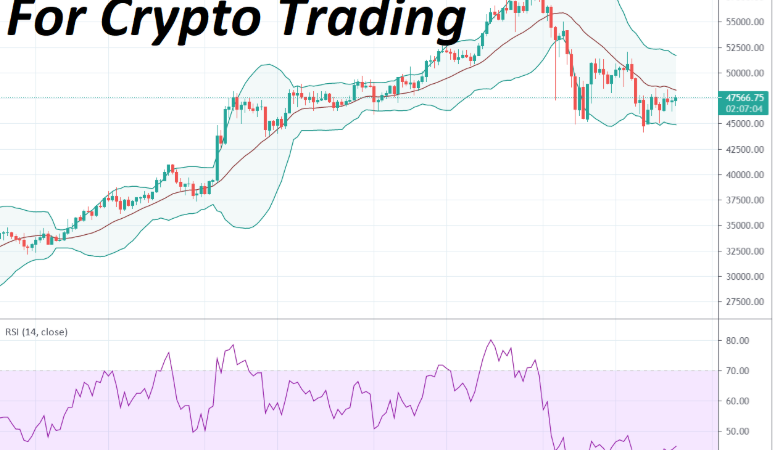
Bollinger Bands consist of three lines overlaid directly onto the price chart. The middle band is typically a 20-period simple moving average (SMA). The upper and lower bands are calculated by adding and subtracting two standard deviations of price from that middle SMA, which automatically widens the channel during volatile swings and narrows it during calm periods.
Using Bollinger Bands to Measure Volatility
The distance between the upper and lower bands serves as a visual gauge of market volatility. When the bands contract tightly together—a pattern known as a “squeeze”—it indicates low volatility and suggests that a significant price breakout may be approaching. Once the breakout occurs, the bands expand rapidly as price momentum accelerates.
Using Bollinger Bands for Support and Resistance
In range-bound markets, the outer bands often act as dynamic levels of support and resistance. When the price touches or briefly pierces the lower band, buyers frequently step in and push the price back toward the middle 20-period SMA. Conversely, rallies into the upper band often encounter selling pressure, while the middle band itself frequently acts as support during uptrends and resistance during downtrends.
Using Bollinger Bands for Buy and Sell Signals
Traders use Bollinger Bands differently depending on whether the market is ranging or breaking out. In a sideways market, a trader might buy when the price bounces off the lower band and sell near the upper band. During a squeeze breakout, however, a decisive candle close outside the upper band on strong volume is often treated as a bullish signal to enter in the direction of the new trend.
Limitations of Bollinger Bands
Bollinger Bands do not predict the direction of a breakout a squeeze only signals that volatility is likely to increase, not whether the price will move up or down. Additionally, during a strong trend, the price can “walk the band” by repeatedly hugging the upper or lower boundary, which can trap traders who automatically buy or sell every time an outer band is touched.
On-Balance Volume (OBV)
On-Balance Volume (OBV) is a momentum indicator that uses trading volume flow to predict changes in cryptocurrency prices. Based on the principle that volume precedes price, OBV tracks cumulative buying and selling pressure to show whether large market participants are accumulating or distributing an asset.
How to Calculate On-Balance Volume
OBV is calculated as a running total that adds or subtracts each period’s volume depending on how the price closes. If a cryptocurrency closes higher than the previous period’s close, all of that period’s volume is added to the previous OBV value. If the price closes lower, the period’s volume is subtracted, and if the closing price is unchanged, the OBV remains the same.
Using OBV to Confirm Trend Strength
Traders compare the slope of the OBV line against the price chart to verify whether a trend is backed by genuine participation. If a cryptocurrency’s price is rising and the OBV line is climbing alongside it, the uptrend is confirmed by strong buying volume. If the price rises while the OBV stays flat, it indicates weak conviction behind the rally.
Using OBV for Divergences
Divergences between OBV and price often serve as early warnings of an upcoming reversal. When a cryptocurrency’s price continues making higher highs, but the OBV line fails to reach new highs, it suggests that buyers are losing strength and a downward reversal could follow. Conversely, if the price makes lower lows while OBV trends upward, it signals underlying accumulation before a potential bullish turn.
Using OBV for Breakout Signals
Traders also apply trendlines and horizontal resistance levels directly to the OBV indicator itself. When the OBV breaks above a key resistance level before the price chart does, it can act as an early bullish signal that buying pressure is building for a breakout. Similarly, a breakdown in OBV below support often precedes a drop in price.
Limitations of On-Balance Volume
Because OBV adds or subtracts an entire period’s volume regardless of whether the price moved by 0.1% or 10%, a single massive volume spike can distort the indicator for days or weeks. In crypto trading, fragmented liquidity across multiple exchanges can also mean that volume data from a single exchange does not reflect the entire market.
Ichimoku Cloud
The Ichimoku Cloud, also known as Ichimoku Kinko Hyo, is an all-in-one technical analysis indicator that displays trend direction, momentum, and dynamic support and resistance levels on a single chart. Although it looks complex at first glance, it gives crypto traders a structured overview of market equilibrium at a glance.
Components of the Ichimoku Cloud
The indicator is made up of five lines calculated from midpoint averages of highs and lows over 9, 26, and 52 periods. The Tenkan-sen (conversion line) and Kijun-sen (base line) track short- and medium-term price momentum, while the Chikou Span (lagging span) plots current closing prices 26 periods back. Finally, Senkou Span A and Senkou Span B are projected 26 periods forward, and the shaded area between them forms the “cloud” (Kumo).
Using the Ichimoku Cloud for Trend Identification
The position of the price relative to the cloud provides a quick read on the prevailing trend. When a cryptocurrency trades above the cloud, the overall trend is considered bullish; when it trades below the cloud, the trend is bearish. Traders also watch the color of the cloud itself, which turns green when Senkou Span A is above Senkou Span B (bullish) and red when Senkou Span B is above Senkou Span A (bearish).
Using the Ichimoku Cloud for Support and Resistance
Unlike static horizontal lines, the Ichimoku Cloud acts as a moving zone of support and resistance. During an uptrend, pullbacks frequently find support at the top or bottom edge of the cloud before continuing higher. Furthermore, a thicker cloud represents stronger support or resistance that is harder for the price to break through, whereas a thin cloud indicates a weaker barrier.
Using the Ichimoku Cloud for Buy and Sell Signals
Traders look for alignment across multiple components before entering a trade. A classic bullish signal occurs when the faster Tenkan-sen crosses above the slower Kijun-sen while the price is positioned above a green cloud. Conversely, a bearish sell signal occurs when the Tenkan-sen crosses below the Kijun-sen beneath a red cloud.
Limitations of the Ichimoku Cloud
Because the Ichimoku Cloud plots five lines simultaneously, it can clutter a chart and feel overwhelming for beginners. Like moving averages, its calculations are based on historical prices, meaning it lags during sudden reversals and tends to produce conflicting signals when crypto markets move sideways inside the cloud.
Fibonacci Retracement
Fibonacci retracement is a charting tool used to identify potential support and resistance levels where a cryptocurrency’s price might pause or reverse during a pullback. Based on mathematical ratios derived from the Fibonacci sequence, it helps traders plan structured entries, targets, and stop-loss placements within an existing trend.
How to Calculate Fibonacci Retracement Levels
Rather than relying on a continuous time-series formula, Fibonacci retracement levels are drawn manually between two major price extremes on a chart. In an uptrend, a trader selects a clear swing low and drags the tool to a swing high; in a downtrend, it is drawn from a swing high to a swing low. The vertical distance between those two points is then divided by key Fibonacci percentages—most commonly 23.6%, 38.2%, 50%, 61.8%, and 78.6%—to plot horizontal levels.
Using Fibonacci Retracement for Support and Resistance
Once plotted, these horizontal ratios act as potential floors during downward pullbacks and ceilings during upward bounces. The 38.2% and 61.8% levels (often called the “golden ratio”) are watched particularly closely by crypto traders, as prices frequently stall or reverse around these zones.
Using Fibonacci Retracement for Trend Continuations
Fibonacci levels help traders distinguish between a healthy temporary pullback and a full trend reversal. In a strong uptrend, a cryptocurrency may retrace 38.2% or 50% of its prior rally before buyers step back in to push the price to new highs. If the price breaks decisively past the 78.6% level, it typically indicates that the original trend has failed.
Using Fibonacci Retracement for Entry and Exit Points
Traders use Fibonacci retracement levels to time limit orders rather than chasing green candles. For example, during an uptrend, a trader might place a buy order near the 50% or 61.8% retracement level once bullish candlestick confirmation appears, while placing a stop-loss order just below the next Fibonacci level to manage downside risk.
Limitations of Fibonacci Retracement
Selecting the starting swing high and swing low involves a degree of subjectivity, meaning two traders may draw slightly different levels on the same chart. Because Fibonacci ratios are static horizontal lines rather than dynamic momentum measures, they work best when confirmed by volume, candlestick patterns, or other technical indicators.
Stochastic Oscillator
The Stochastic Oscillator is a momentum indicator that compares a cryptocurrency’s closing price to its overall price range over a specific period. Built on the observation that prices tend to close near the top of their range during uptrends and near the bottom during downtrends, it helps traders spot momentum shifts before price reversals occur.
How to Calculate the Stochastic Oscillator
The indicator tracks two lines plotted on a scale from 0 to 100. The primary line, called %K, measures where the current closing price sits relative to the highest high and lowest low over a standard 14-period lookback window. A second line, called %D, is calculated as a 3-period simple moving average of %K to smooth out fluctuations and act as a signal line.
Using the Stochastic Oscillator for Overbought and Oversold Conditions
Like the RSI, the Stochastic Oscillator uses upper and lower threshold zones to flag extreme price readings. Readings above 80 indicate that the cryptocurrency is trading near the top of its recent range and may be overbought. Readings below 20 suggest that the asset is trading near the bottom of its recent range and may be oversold.
Using the Stochastic Oscillator for Divergences
Traders monitor the %K and %D lines for divergences that signal an impending change in direction. If a cryptocurrency drops to a lower low on the price chart while the Stochastic Oscillator forms a higher low below 20, this bullish divergence points to weakening downward momentum. A bearish divergence occurs when the price prints a higher high while the oscillator records a lower high above 80.
Using the Stochastic Oscillator for Buy and Sell Signals
Crossovers between the %K and %D lines inside overbought or oversold zones provide actionable trade triggers. A bullish buy signal occurs when the faster %K line crosses above the slower %D line while both are below the 20 threshold. A bearish sell signal occurs when the %K line crosses below the %D line while both are above the 80 level.
Limitations of the Stochastic Oscillator
Because the Stochastic Oscillator is highly sensitive to short-term price swings, it can generate frequent false signals in volatile crypto markets. During sustained directional trends, the indicator can stay pinned above 80 or below 20 for long stretches, leading to premature exits if used without a trend filter.
Aroon Indicator
The Aroon Indicator is a trend-following technical tool designed to measure whether a cryptocurrency is in a trend, how strong that trend is, and when a new trend is beginning. Rather than measuring the magnitude of price changes, it focuses on the amount of time that has passed since the highest high and lowest low occurred.
How to Calculate the Aroon Indicator
The indicator consists of two lines – Aroon Up and Aroon Down – calculated over a standard 25-period window and plotted between 0 and 100. Aroon Up measures the percentage of time elapsed since the highest price within those 25 periods, while Aroon Down measures the percentage of time elapsed since the lowest price. A reading of 100 means a new high or low occurred on the current candle, whereas a reading of 0 means no new high or low has occurred for all 25 periods.
Using the Aroon Indicator for Trend Strength and Consolidation
The relative positions of Aroon Up and Aroon Down reveal the underlying strength of a market move. When Aroon Up stays above 70 while Aroon Down remains below 30, it signals a strong, established uptrend; the opposite alignment indicates a strong downtrend. When both lines fall below 50 and move parallel to each other, it signals that the market is consolidating in a sideways range.
Using the Aroon Indicator for Trend Reversals
Traders watch for shifts in the Aroon lines to catch trend transitions early. When an uptrend begins to weaken, Aroon Up starts declining from near 100 while Aroon Down begins climbing from near 0, indicating that buyers are no longer pushing prices to fresh highs and sellers are gaining ground.
Using the Aroon Indicator for Buy and Sell Signals
Crossovers between the two Aroon lines are commonly used to generate directional trade signals. When Aroon Up crosses above Aroon Down and moves toward 70 or higher, it generates a bullish buy signal suggesting a new uptrend is forming. Conversely, when Aroon Down crosses above Aroon Up, it generates a bearish sell signal indicating that downward momentum is taking over.
Limitations of the Aroon Indicator
Because the Aroon Indicator only tracks when highs and lows occur rather than how much the price actually moved, a tiny marginal new high carries the same weight as a massive rally. Additionally, because it relies on past highs and lows over a 25-period window, its signals can lag behind sharp, sudden crypto price reversals.
These are just a few of the many technical indicators available for crypto trading. The best indicators for you will depend on your trading style, risk tolerance, and the specific cryptocurrencies you are trading. It is important to use a combination of indicators and to always do your own research before making any trading decisions.
Frequently Asked Questions
How many technical indicators should I use on a crypto chart at once?
Most experienced traders limit their charts to two or three complementary indicators rather than crowding the screen with five or six tools. Using multiple indicators from the same category – such as combining the RSI and the Stochastic Oscillator – often creates redundancy because both measure momentum in similar ways. A more effective approach is to pair one trend indicator (like a moving average), one momentum indicator (like the RSI or MACD), and one volume indicator (like OBV) so each tool provides a distinct perspective on price action.
Which chart timeframes work best with crypto trading indicators?
The ideal timeframe depends on how long you plan to hold a position, though higher timeframes generally produce more reliable indicator signals. Day traders and scalpers commonly apply indicators to 15-minute or 1-hour charts to capture intraday swings, while swing traders tend to rely on 4-hour and daily charts where market noise is lower. Many traders also check a higher timeframe first to identify the primary trend before dropping down to a lower timeframe to fine-tune their entries.
Why do technical indicators behave differently in crypto than in traditional stock markets?
Unlike traditional stock exchanges that close overnight and on weekends, cryptocurrency markets operate 24 hours a day, 7 days a week. Because trading never stops, there are no overnight price gaps on major spot crypto charts, and indicators update continuously across global time zones. In addition, crypto assets typically exhibit higher baseline volatility and thinner order books – especially among smaller altcoins—which can cause indicators to swing between extremes much faster than they do on large-cap equities.
Should I customize the default settings on my trading indicators?
Default settings—such as a 14-period RSI or a 12-26-9 MACD – are widely used because thousands of traders and automated trading algorithms watch those exact levels, making them self-fulfilling reference points. While some crypto traders shorten lookback periods to make indicators react faster to 24/7 price action or lengthen them to filter out noise, beginners are generally better off learning how standard settings behave before adjusting parameters for specific trading strategies.
Can technical indicators predict sudden crypto crashes or major news events?
No. Technical indicators only process historical price and volume data; they cannot foresee external catalysts such as regulatory announcements, exchange outages, macroeconomic shifts, or large whale liquidations. Because unexpected news can instantly invalidate even the clearest chart setup, traders should always pair technical analysis with strict risk management practices, including position sizing and stop-loss orders.
How can beginners practice using these indicators without risking real money?
Beginners can test how different indicators perform by using paper trading accounts or backtesting tools available on major charting platforms. Paper trading simulates live market conditions with virtual funds, allowing you to practice reading crossovers, divergences, and support levels in real time without financial risk. Reviewing historical charts to see how an indicator behaved during past bull runs, crashes, and sideways ranges is another practical way to build confidence before trading with real capital.