Crypto market is super hot right now and people all over the World are trying to make money in it. There are many ways of making money with crypto currencies. For example if you are a content creator like me you can take advantage of various affiliate programs. We created a cool list of the best crypto affiliate programs if you want to learn more. But today let’s talk about another form of money making – crypto trading.
What are the best trading indicators for crypto?
We prepared a list of 6 most commonly used indicators for cryptocurrency trading. The list of course is not finite. There are more complex indicators. But I believe that the best ones are those that are used by many traders. In other words the most popular indicators are the best.
Look at it this way. Why do indicators work in the first place? Because many people believe they do. If price reaches for example Fibonacci Retracement level, it means nothing to the price of the commodity. But, what if many traders believe that this exact Fibonacci level is the turnpoint for crypto price? They’ll start buying or selling as soon as the price reaches that level. Making the price bounce in the opposite direction of the retracement level. So, this is the reason why traders, especially new ones, should trust the most popular indicators.
So, the most popular crypto trading indicators are:
- RSI
- MACD
- Volumes
- Bollinger Bands
- Fibonnaci Retracement levels
- Trend lines
- Moving Averages
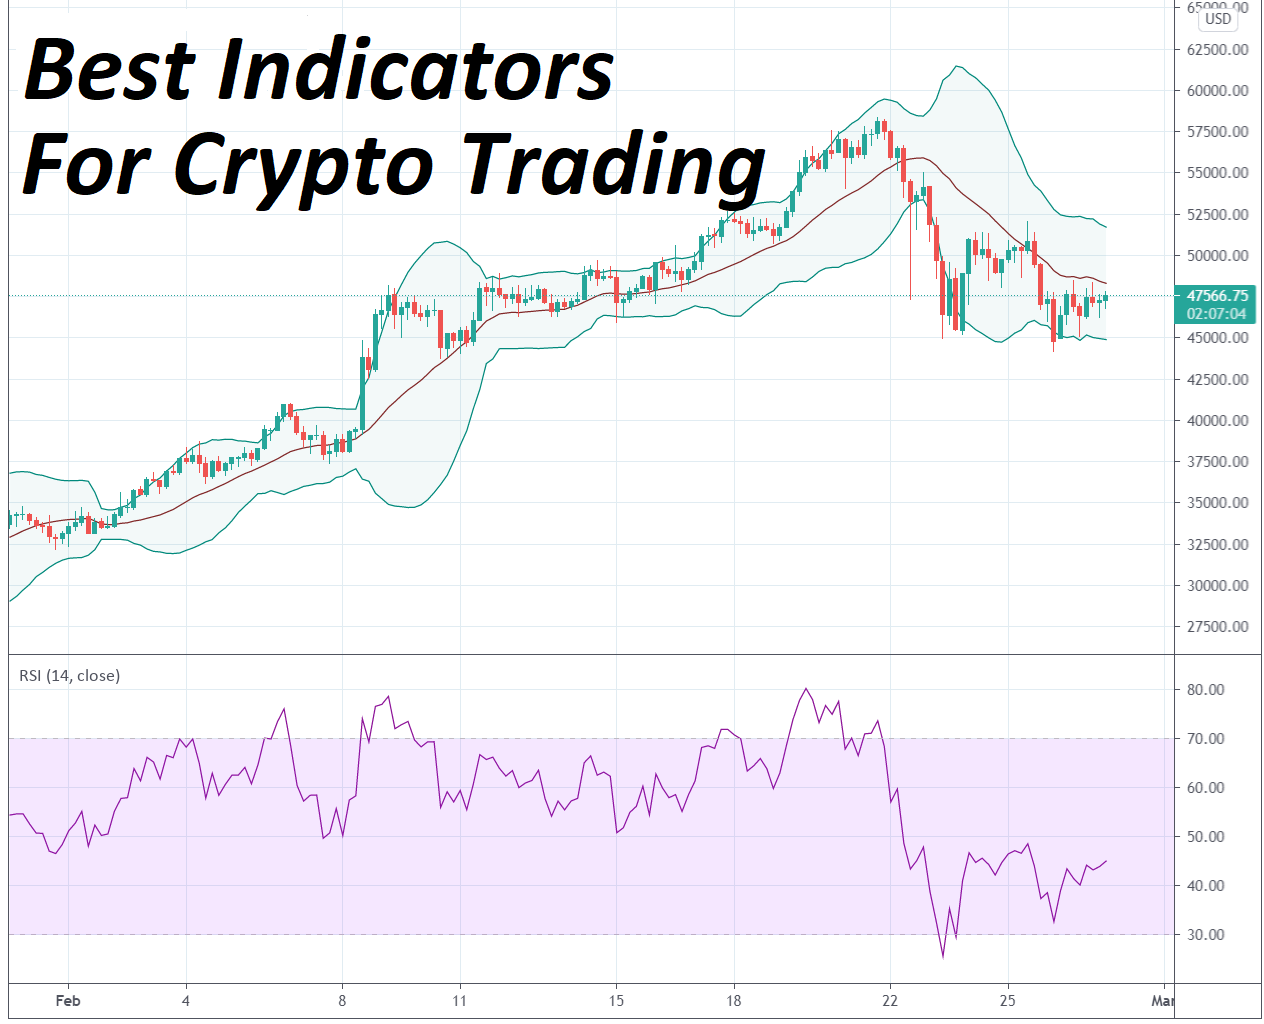
RSI (Relative Strength Index)
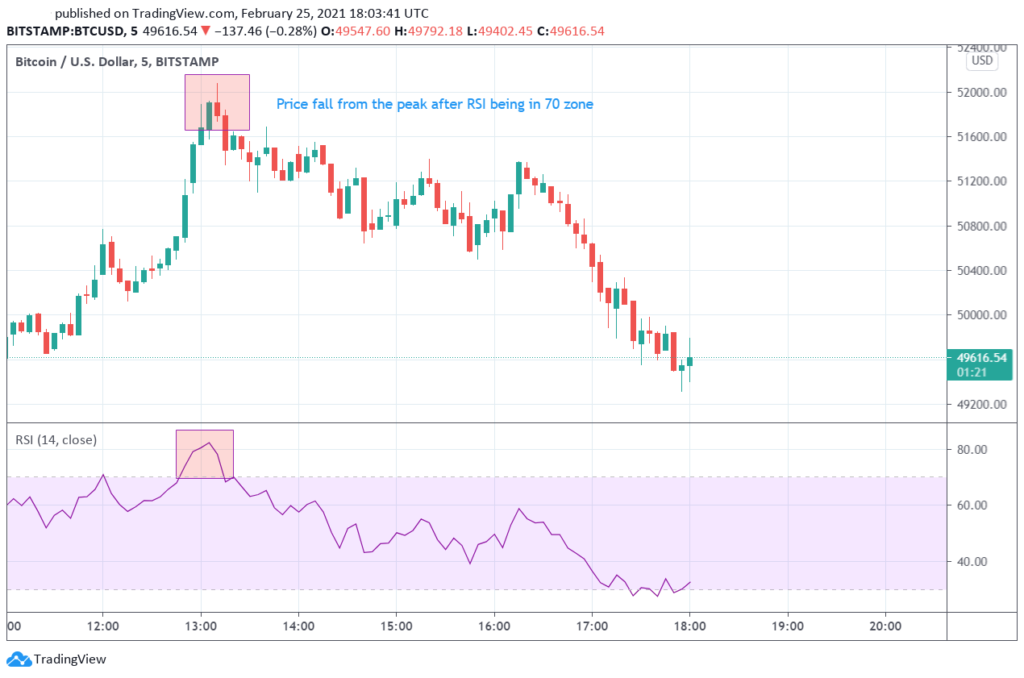
RSI or relative strength index is an oscillator that shows when price is overbought or oversold. It shows price momentum. Index goes from 0 to 100. 70 and above usually means that a commodity is overbought, 30 and below means that the commodity is oversold.
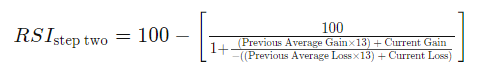
You can calculate RSI meaning with following two step formula:
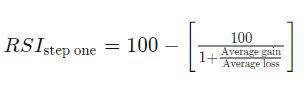
Most commonly used RSI is 14 or 21 periods. This means the index shows previous 14 or 21 candle levels.
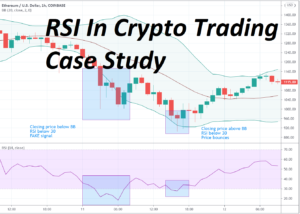
How to use RSI indicator for crypto trading?
RSI in crypto trading could be used as a valuable addition in your strategy, with other indicators. It works well with MACD, as well as Fibonacci Retracement levels and others. The thing is that RSI on its own would not make the strategy. Therefore, it is always better to use more than one indicator in your crypto trading to get more confirmations.
Bellow you can see some classical signals of RSI indicator:
MACD (Moving Average Convergence Divergence)
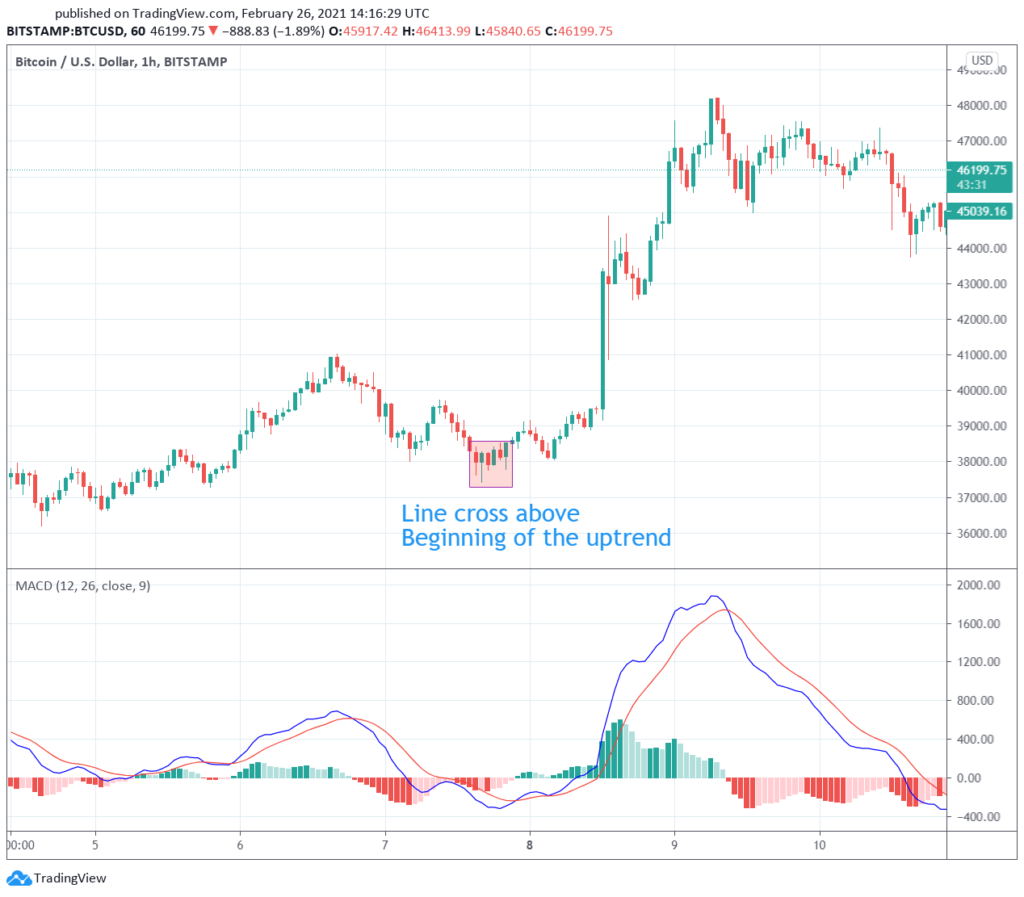
MACD oscillator shows the relationship between two moving averages of crypto price. It is calculated by subtracting 26 period EMA from 12 period EMA. This line from the calculation is the MACD line and the other 9 period EMA is the signal line.
Traders use MACD as a buy signal when these lines cross above and as a sell signal when lines cross below. MACD also helps traders to determine if the market is overbought or oversold.
How to use MACD indicator for crypto trading?
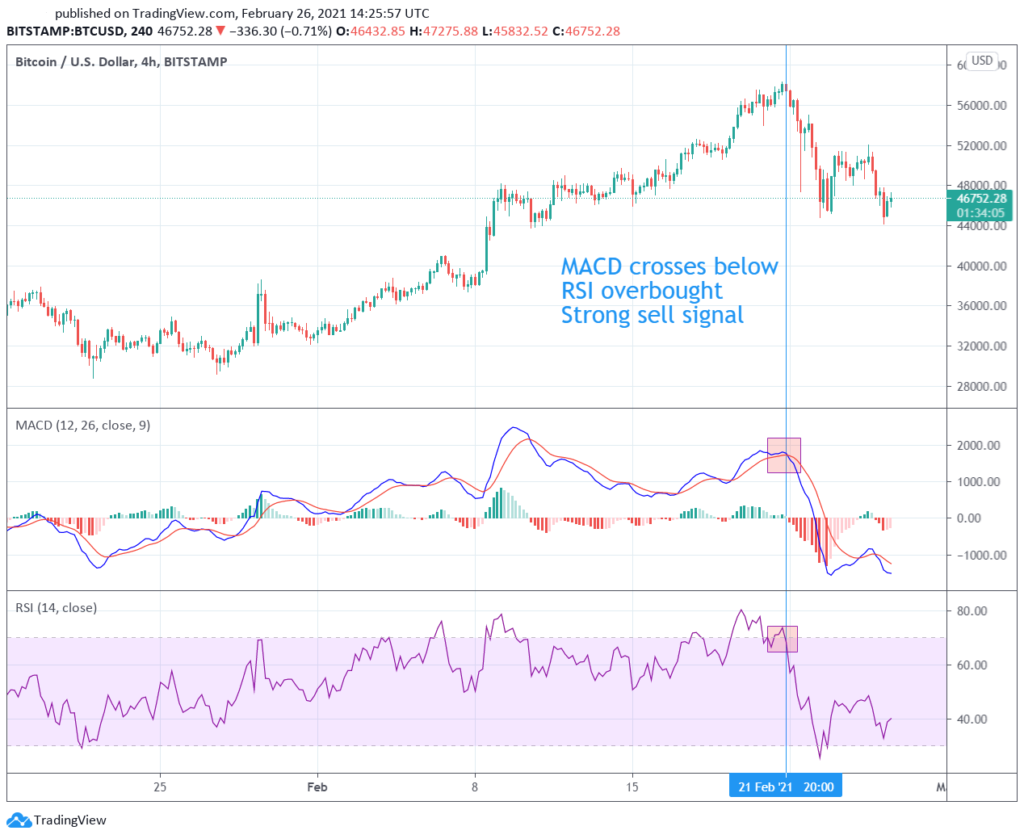
Traders use MACD indicators along with RSI in crypto trading. This combination gives more certain signals in overbought and oversold zones. To find reversal points traders use trend lines and volume as well.
Example of usage MACD in crypto trading:
MACD with other indicators:
Volume
Volume is a crucial indicator in crypto trading, reflecting the buying and selling activity of a particular cryptocurrency within a specified period. It’s a valuable tool for understanding market sentiment, identifying trends, and making informed trading decisions.
Traders often use the terms “Up Volume” and “Down Volume” to distinguish between volume associated with price increases and price decreases.
Up Volume is when the volume of crypto tokens increases as the value rises, it indicates strong buying pressure. This suggests that more traders are willing to buy the cryptocurrency at its current price, potentially signaling a continuation of the upward trend
Down Volume is when the volume increases as the value plunges, it indicates strong selling pressure. This suggests that more traders are eager to sell the cryptocurrency at its current price, potentially signaling a continuation of the downward trend.
How to use volume in trading?
So, one way of using volume in trading is with price action. Traders should look for traditional formations such as pin bars or inside bars.
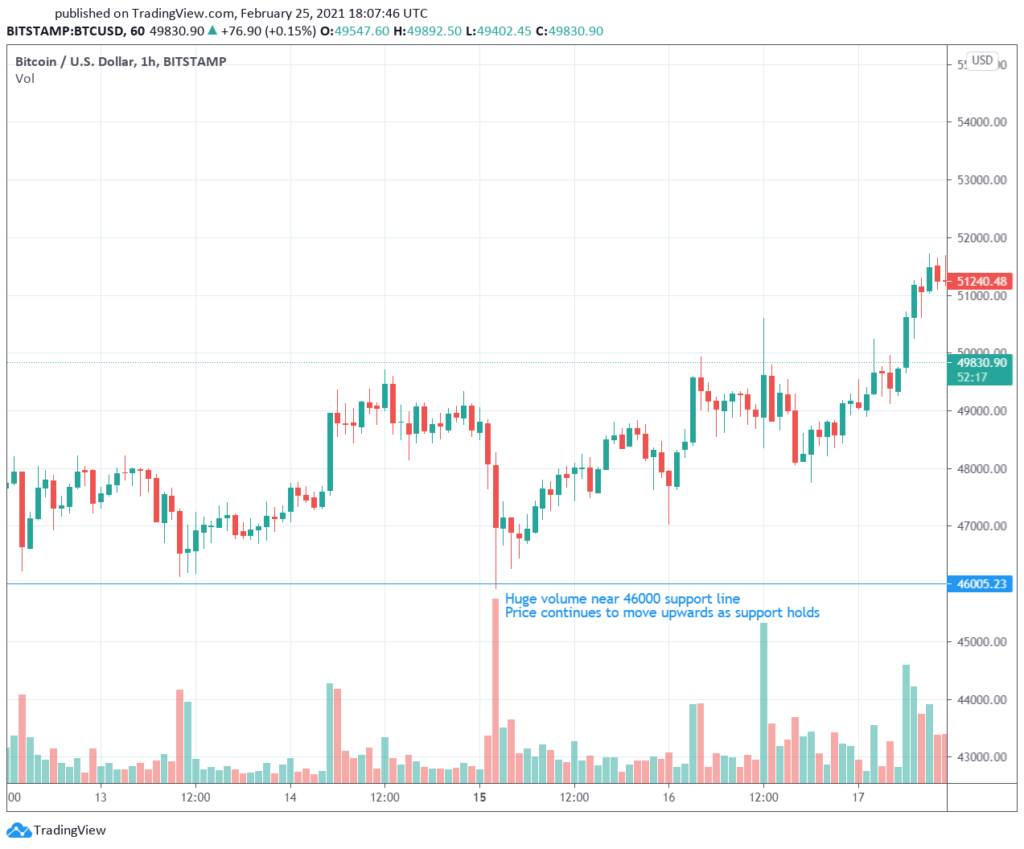
As seen below, large volume on short-bodied candles could mean consolidation. If the market consolidates near high or lows, this could mean that the market will do a reversal soon. In this case we need to find a confirmation candle and put a stop loss below reversal point.
Near support or resistance levels we are used to seeing larger volumes as well. Once again large volume alone does not mean anything. It is more important to look for confirmation candles. In the following example we can see where price reaches support and resistance level, volume goes up. After that a confirmation candle shows where commodity price could go next.
Bollinger Bands
Bollinger Bands indicator is a three line setup. Middle one is a simple moving average, upper and lower lines show standard deviations from SMA.
Contrary to many traders believe BB do not show overbought and oversold zones. Standard deviation shows volatility of the market. So, if upper and lower bands are closer this means low volatility and vice versa.
How to use Bollinger Bands indicator in crypto trading?
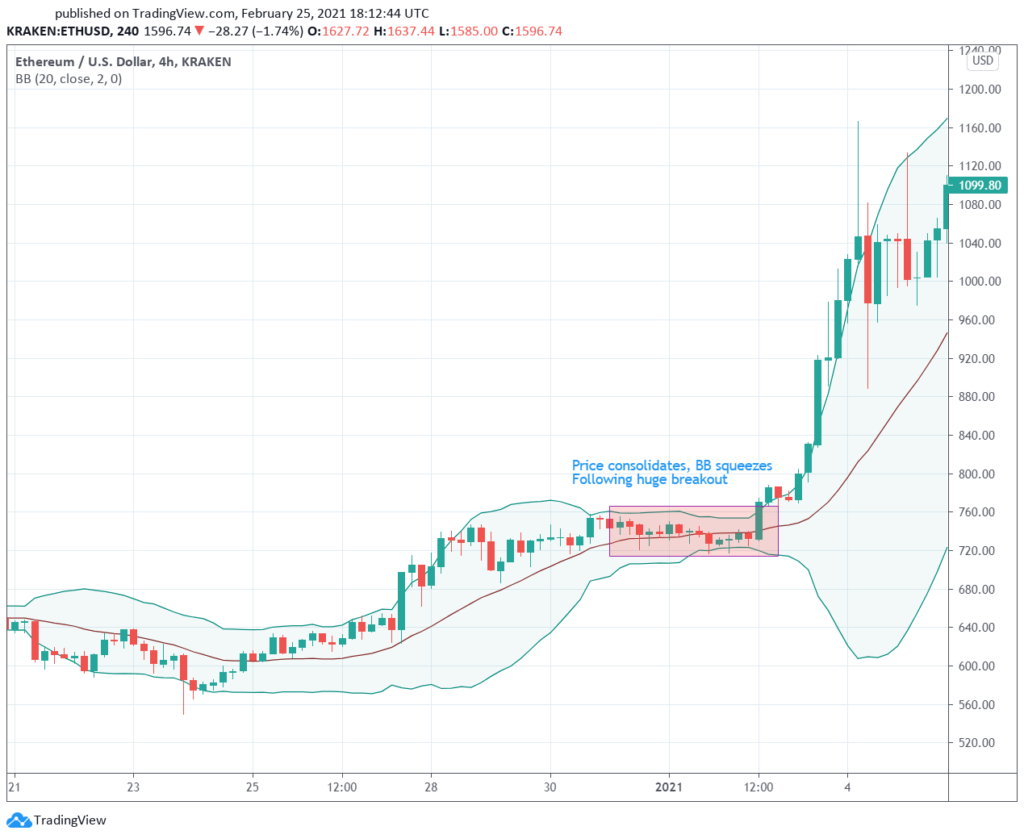
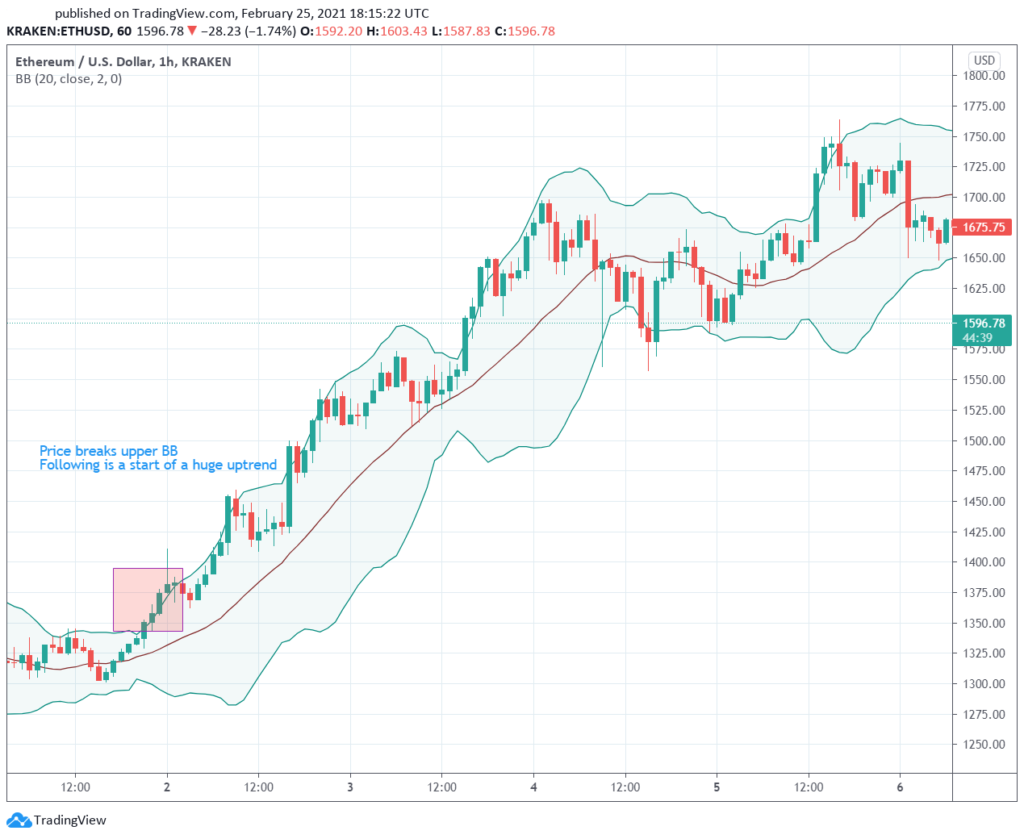
As many indicators Bollinger Bands will not be as useful alone as in your crypto trading strategy. BB’s shows volatility of the market. 90 percent of the time the price of commodities is between two bands. So, breakout outside this zone could mean the start of the bigger movement.
Also, if bands come relatively closer together this could mean consolidation. Consolidation means that there is a battle between bulls and bears. So, traders could expect higher volatility after BB’s squeezes. This however should not be considered as a trading signal on its own.
Once again below could be seen some classical examples of Bollinger Bands signals in crypto trading:
Fibonacci Retracement
Fibonacci Retracement levels are considered as support and resistance zones. Those levels are percentages from previous peaks. The Fibonacci Retracements are 23.6, 38.2, 61.8, 78.6 and 50, which is technically not a Fib level, but is still used in trading.
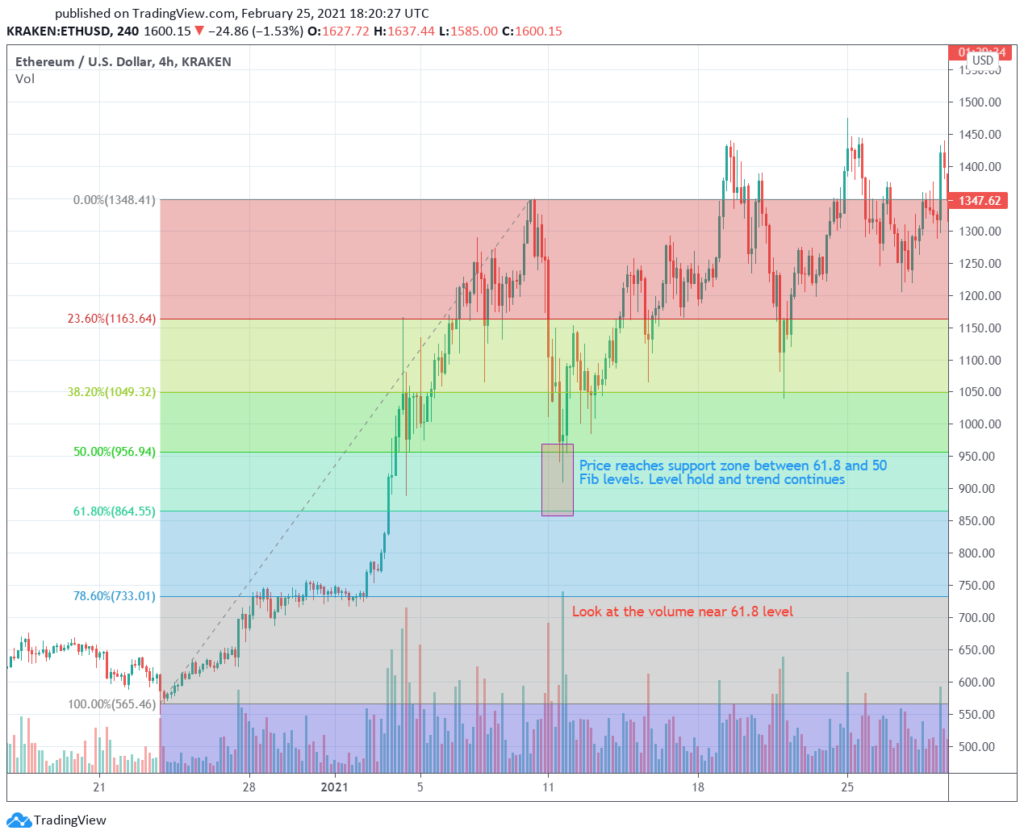
Fibonacci Retracement levels act like support, resistance levels for stop-loss or take-profit goals. Levels on their own shows how much the price retraced after reaching a peak. So, when the price of crypto tests does not break Fib level it means trend continuation. Therefore, breaking key levels such as 50 and 61.8 could mean the end of the trend.
How to use Fibonacci Retracement in trading?
When prices are near Fibonacci Retracement levels, traders are looking for confirmation whether the level will hold or not. For example, high volume near the level and big candle towards the previous peak could mean that level holds. On the other hand, small volume and small bounce from the level would not be considered as trend continuation.
Several examples of Fibonacci Retracement levels usage in crypto trading below:
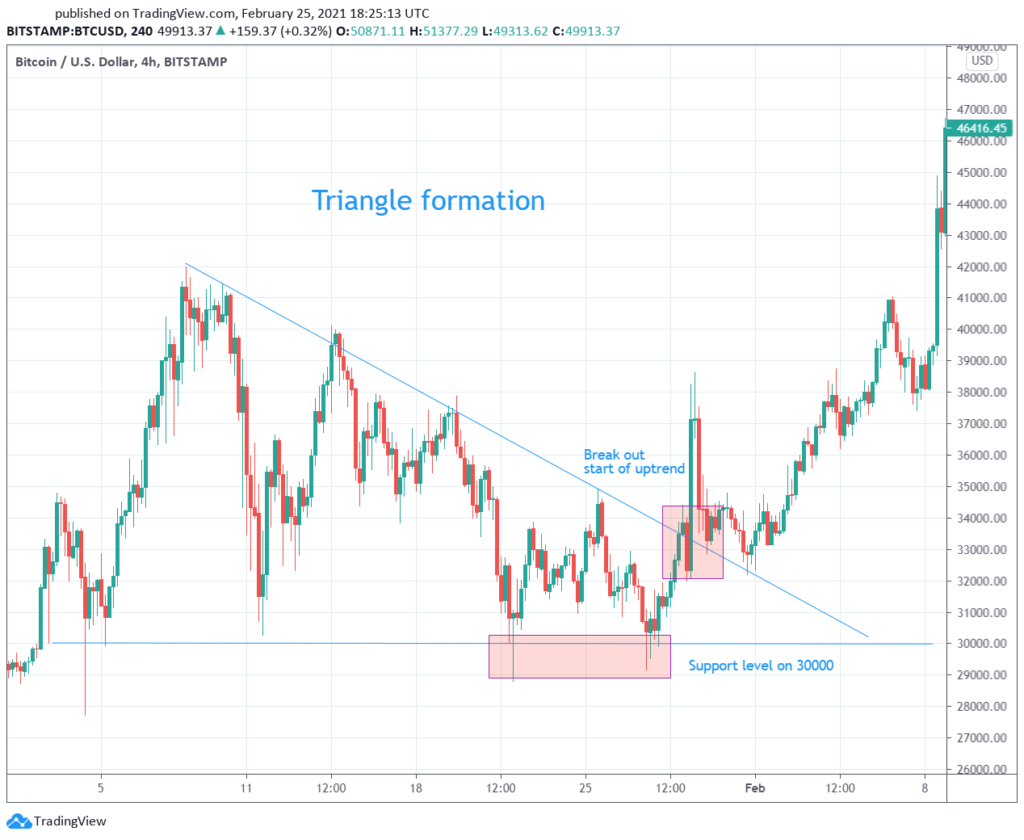
Trend Lines
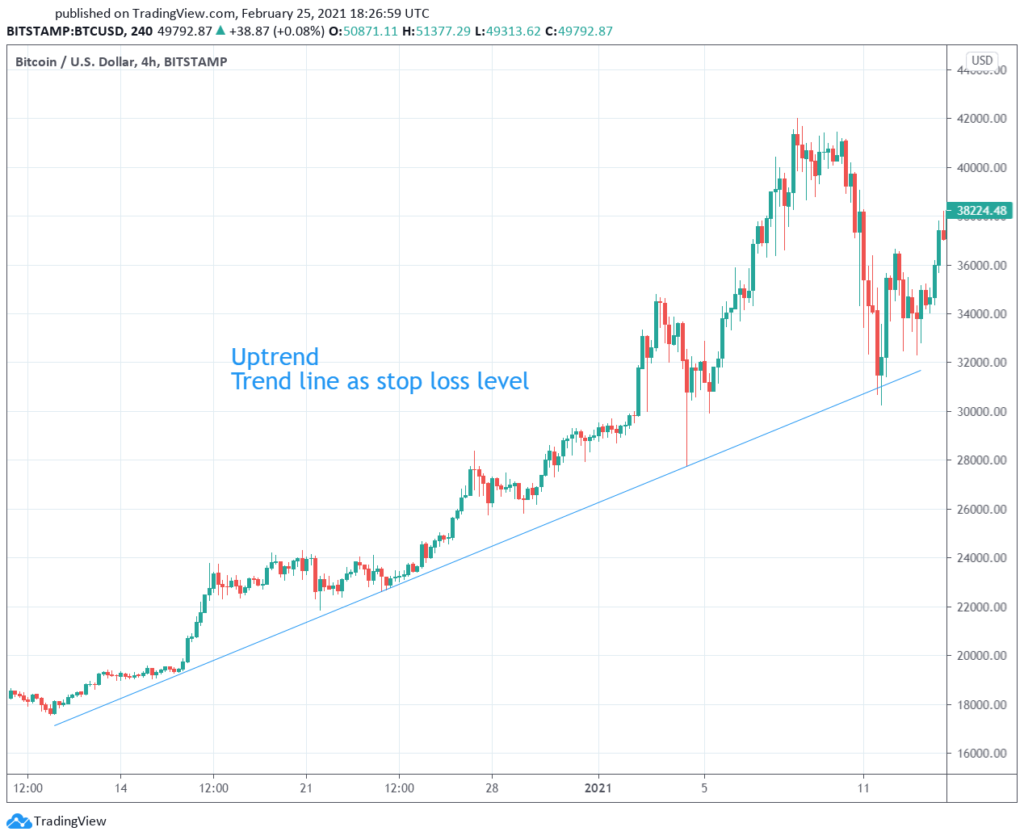
Trend lines are lines that are drawn in the price chart through price peaks. These lines are usually treated as support and resistance levels. If there is more than one trend line in a chart, they could form various patterns such as tunnels, triangles, flags and others.
Those patterns are commonly used by traders in larger timeframes (like 1h or daily chart). Since there are few rules on how these lines should be drawn, this indicator is very speculative. Meaning that opinions on the same charts could differ from trader to trader. It is an interesting and creative way of looking in the crypto market. But, trend lines also require lots of practice and knowledge.
Moving Averages
Moving averages are one of the most basic indicators there is. Calculation is simple, the line shows the close price (could be high or low as well) average of some amount of periods. Most traders use 50, 100, 200 and 365 periods of SMA.
Moving averages are divided into simple moving averages (SMA) and exponential moving averages (EMA). SMA means that this is just an average of previous periods. EMA gives greater weight to the most recent data points.
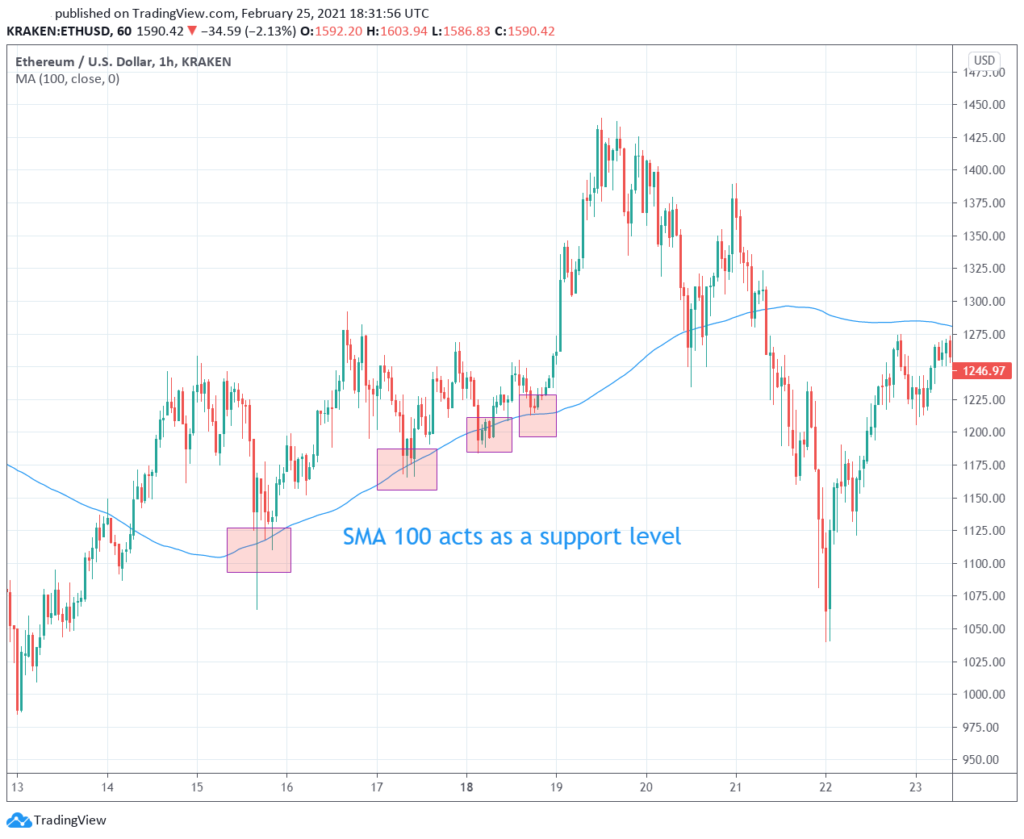
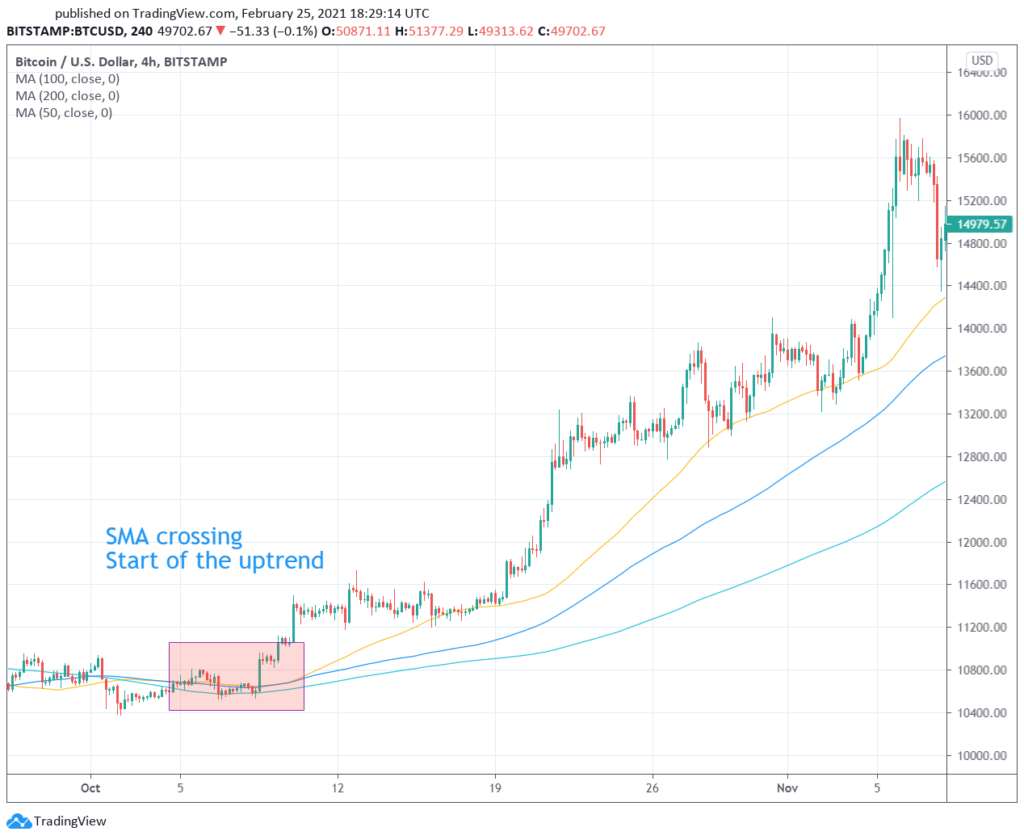
Traders usually use more than one moving average. Crossing of two different time periods MA’s could mean a beginning of the trend. Moving averages could be used as stop-loss or target levels as well.
Some examples of moving averages usage in crypto trading bellow:
FAQ
What are crypto trading indicators?
There are no specific indicators for crypto trading. Crypto market has the same market psychology as any other financial market. So, any indicator that is used for stocks, commodities or other financial instruments could be applied to crypto as well.
Traders in crypto markets tend to use traditional indicators such as moving averages, trend lines, RSI, MACD and others.
How to create a trading strategy?
It is important not to forget that most indicators will not be profitable on their own. Trading strategy could consist of various indicators, price action models, fundamental analysis and many other things.
When it comes to technical analysis traders should backtest their strategy and also live test, before putting any significant amount of money into the strategy. The best tool to test your strategy is Tradingview.com. There you can try various technical strategies and test them.
Conclusion
There is a huge variety of different trading indicators and strategies. Since we know that indicator could work only if many traders believe they do, we choose the most popular ones in our strategies. In this article we discussed RSI, MACD, BB, MA, Volumes, Fibonacci Retracement levels, trend lines and how to apply them in crypto trading. We came to the conclusion that a single indicator won’t make a trading strategy. Trading strategy is something more complex and requires a lot more effort. Be sure we will discuss trading strategies in our future articles!